
Dashboards
The Dashboards section is your personalized hub for tracking and visualizing behavioral user data. It enables you to quickly interpret trends, monitor performance, and share insights with your team.
Dashboard List
To view your dashboards, click the Dashboards link in the left-hand sidebar. This will open the Dashboard List, which displays all dashboards you have access to — including those you've created and those shared with you.
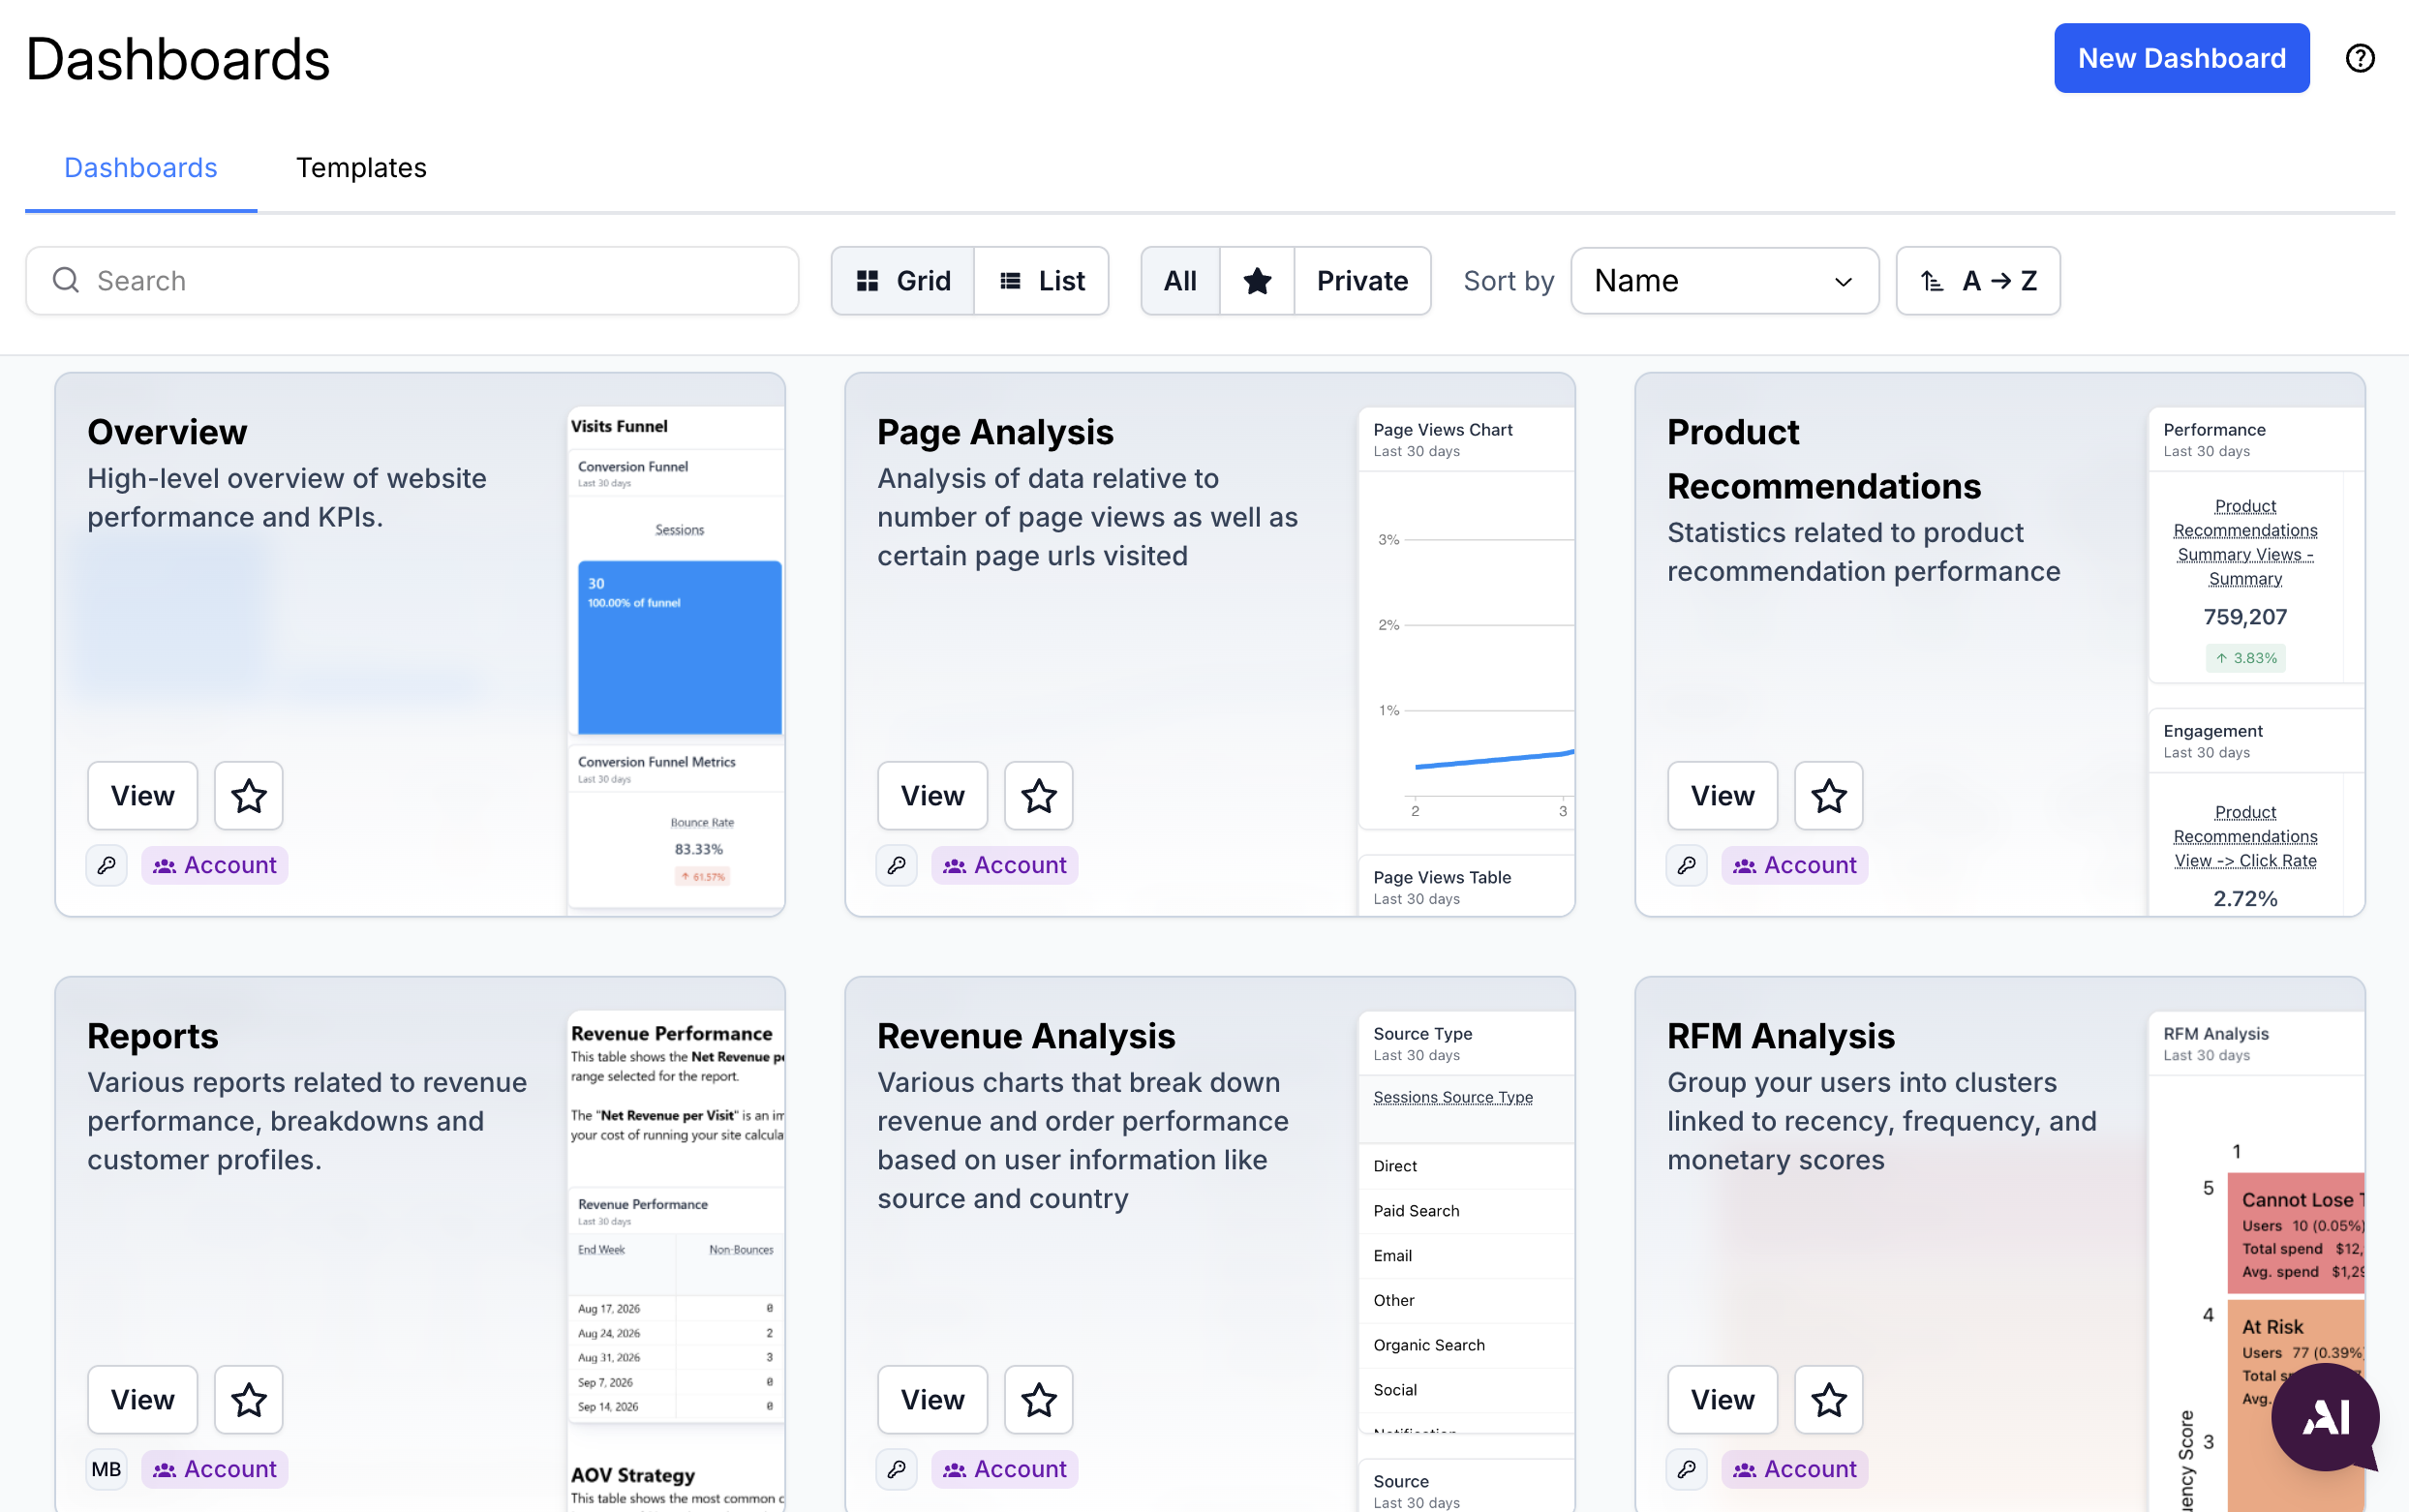 Dashboard List
Navigation & Controls
At the top of the list, you’ll find several controls to help you manage and explore your dashboards:
View Toggle – Switch between a grid view and a list view, depending on your preference
Search Bar – Quickly find dashboards by name, keyword, or tag
Filter Buttons – Use the toggle buttons to refine your view:
All – Displays every accessible dashboard
Starred – Shows only dashboards you’ve marked as favorites
Private – Displays dashboards that are only visible to you
Tag Filter – Click a tag chip above the list to show only dashboards with that tag. See Filtering by Tag.
Sort By – Sort dashboards by name, last updated, date created, or number of tags. Click the direction button next to the dropdown to reverse the sort order. Your chosen sort is remembered in your browser.
Templates
To access pre-built dashboard templates, click the "Templates" tab at the top of the page. These templates are created by Verada and offer a fast way to get started with common dashboard configurations.
Creating a Dashboard
To create a new dashboard, click the "New Dashboard" button in the top-right corner of the dashboard list.
You can choose to:
- Start from scratch - Gives you full control over the layout and data blocks
- Use a template - Select from a range of pre-configured dashboards designed by Verada to jumpstart your insights.
Viewing Dashboards
Dashboards are composed of rows, each containing blocks. Blocks are the individual components within a dashboard and can include:
Text: for notes, commentary and descriptions
Image: for logos and diagrams
Visualizations: charts, graphs, tables, etc.
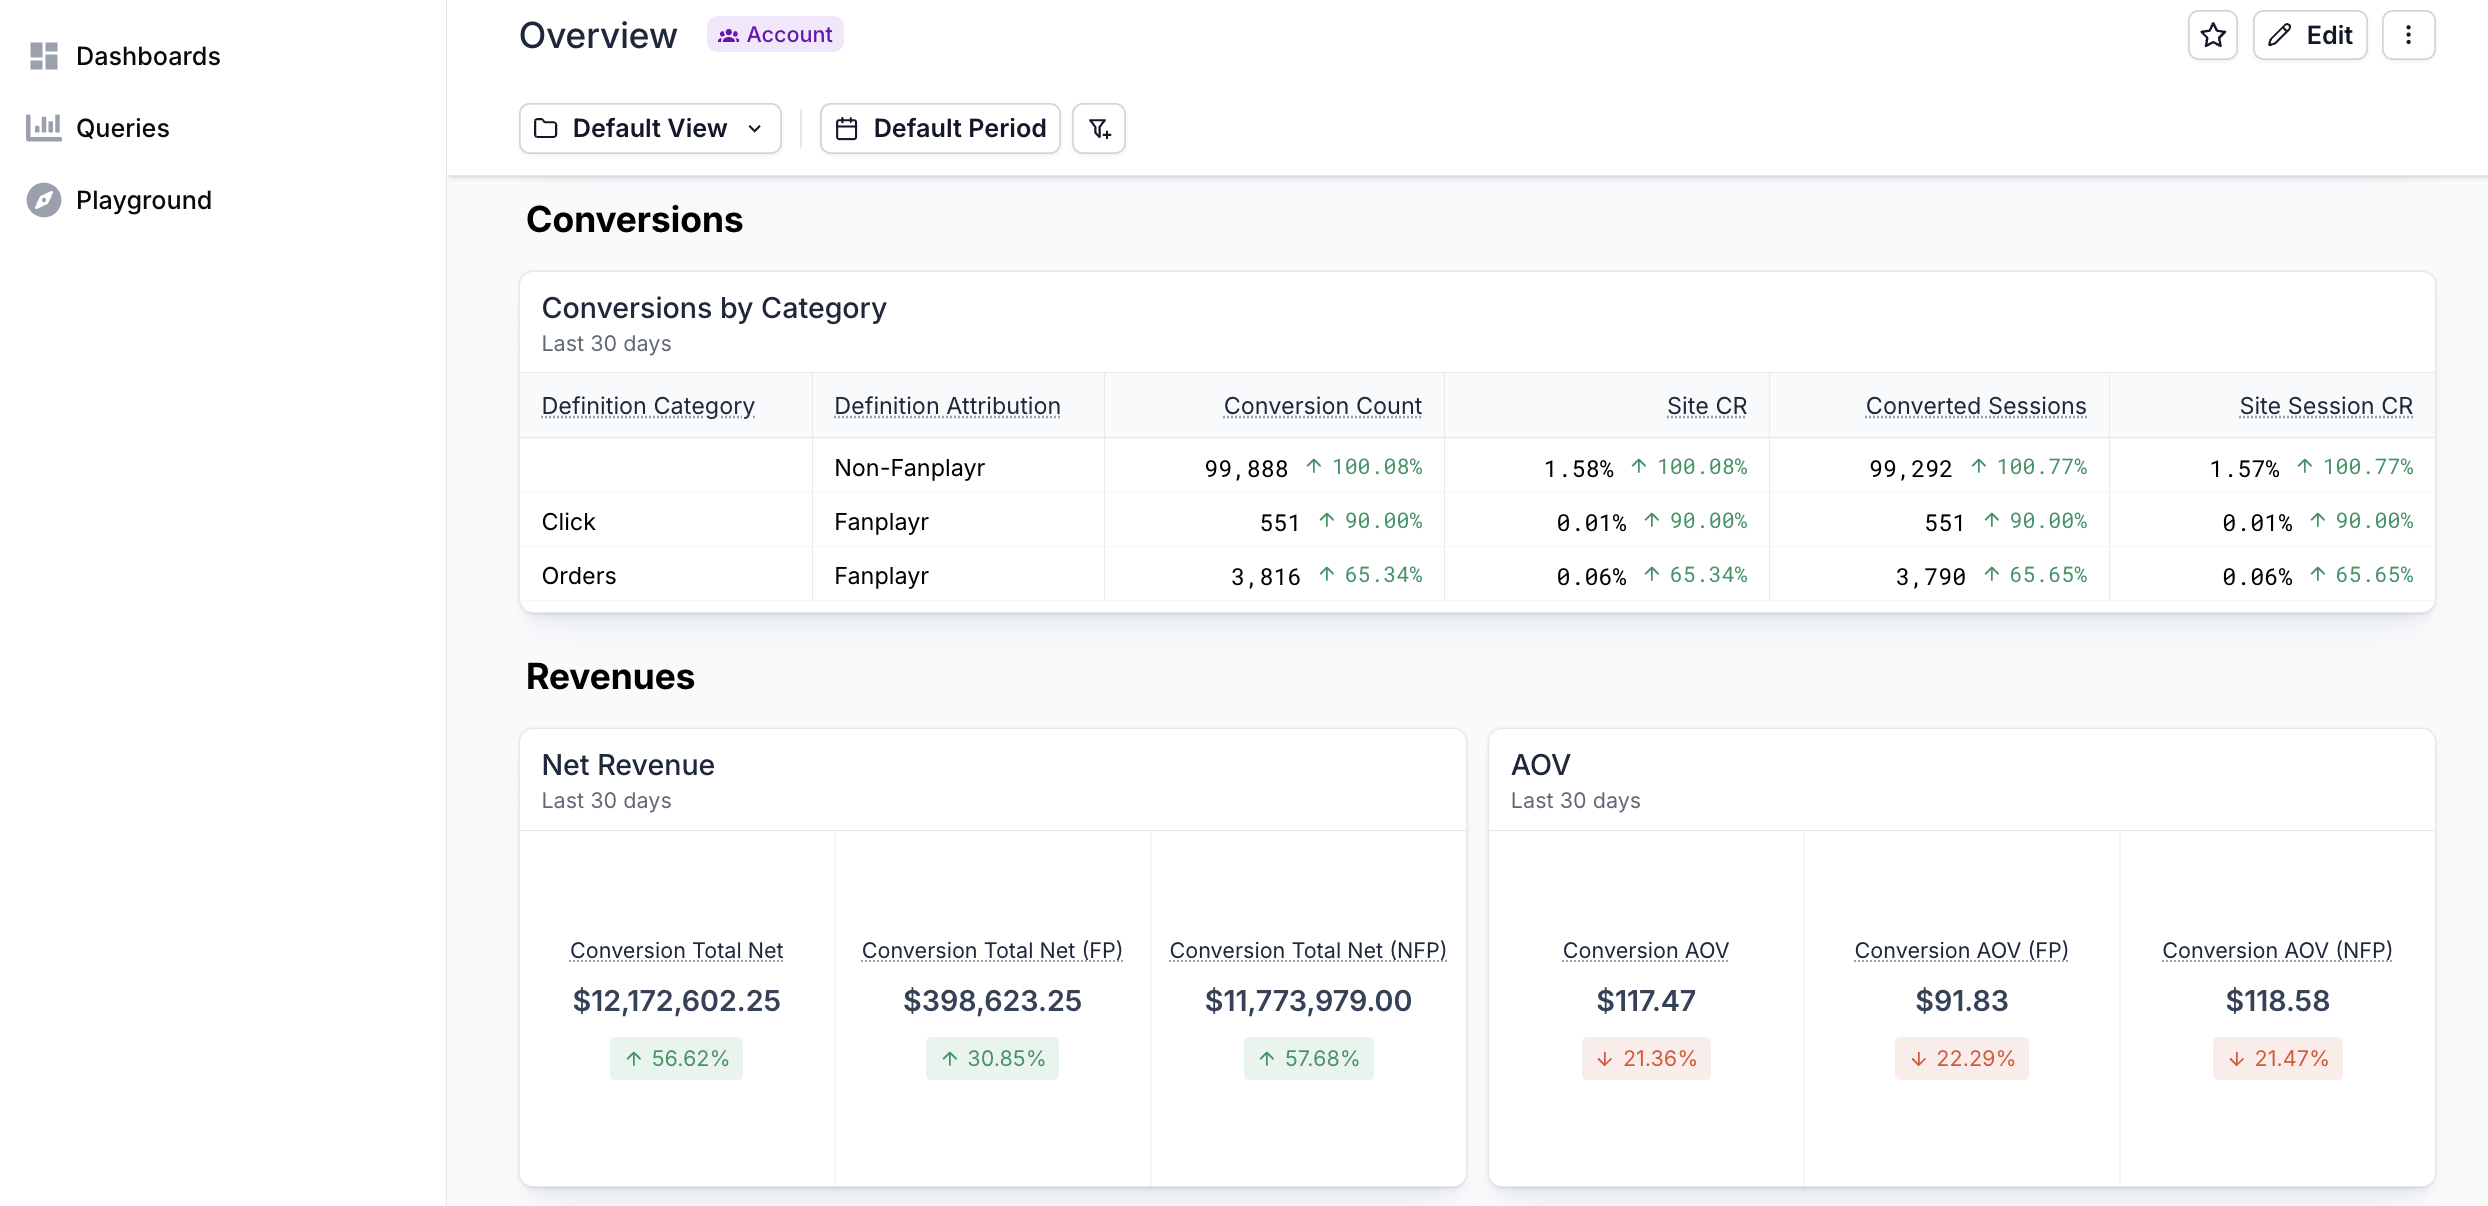 Viewing Dashboard
All visualizations block shares a consistent layout:
Chart Title – The name given to the chart when it was created
Chart Filters – Any filters or custom date range applied at the individual chart level. These are combined with dashboard filters where applicable (see Filtering Data).
Chart Content – The main visualization (e.g. column chart, line chart, table, etc.)
Editing Dashboards
Click the "Edit" button to enter dashboard editing mode.
In this mode, you can:
Reorganize blocks and rows by dragging and dropping
Resize blocks to focus on important visualizations
Add or remove blocks via the buttons on the left side or at the bottom of the dashboard
Full Height Option
If a chart block is the only block in a row, you'll see an additional option in the block settings dropdown: "Enable Full Height". This setting expands the row vertically to fit the full content of the chart, overriding the default row height.
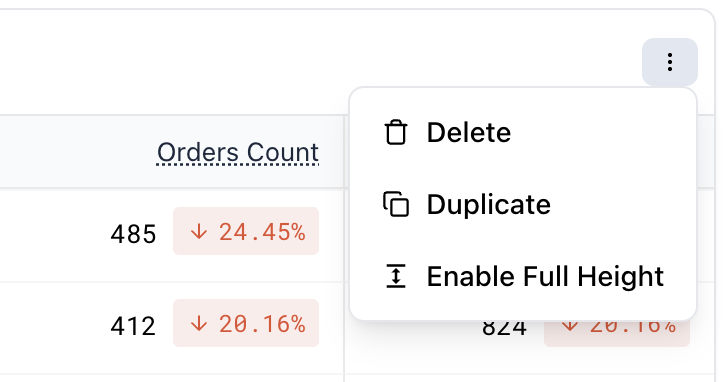 Enable Full Height
INFO
You can only edit dashboards you have permission to modify. For more details, see Sharing Dashboards.
Dashboard Management
Dashboard Actions
You can access dashboard-level actions from the settings dropdown located in the top-right corner of the screen. The available options may vary based on your access level.
Copy Share Link – Generates a shareable link to the dashboard, preserving the current filters and date range.
Duplicate – Creates a new dashboard using the current one as a template. Tags are copied to the new dashboard.
Edit Tags – Add or remove the dashboard's tags. Learn more about dashboard tags.
Access – Manage who can view or edit the dashboard. Learn more about sharing dashboards.
Delete – Permanently removes the dashboard. Only the creator of the dashboard or an account admin can delete the dashboard no matter the access level.
Clear Cache & Refresh - Force refresh the dashboard
Starred Dashboards
You can star dashboards to mark them as important or frequently accessed. Starred dashboards appear in a prioritized section in your dashboard list for easy access. They will also appear as shortcuts in the left sidebar.
Star a dashboard by clicking the star icon in either the dashboard list or at the top of the screen when editing a specific dashboard.
Dashboard Tags
Tags are short labels, such as "Marketing", "Weekly" or "Q3", that help you organize and find dashboards in the dashboard list.
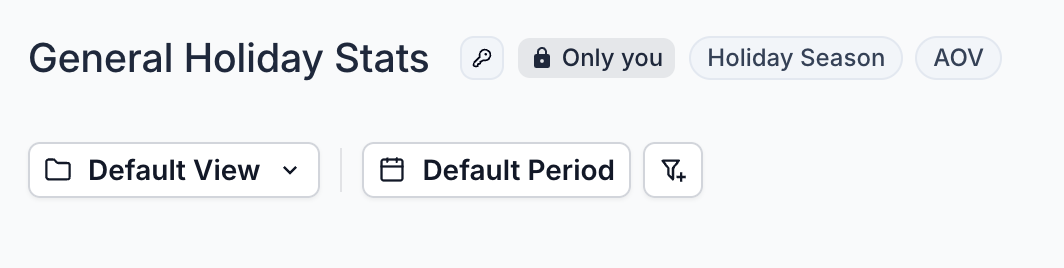 Dashboard Tags
Tags are part of the dashboard, so everyone who can see a dashboard sees the same tags. Anyone who can edit the dashboard can change its tags. Changing tags doesn't require entering edit mode and doesn't change the dashboard's "Updated" date.
Editing Tags
Open the "Dashboard tags" dialog in any of these ways:
- Choose Edit tags from the ⋮ menu on a dashboard row in the dashboard list (list view)
- Choose Edit tags from the dashboard's settings dropdown
- Click a tag in the dashboard header
- Click Add tags in the dashboard header while in edit mode (shown when the dashboard has no tags yet)
In the dialog, type a tag and press Enter to add it, or pick from the Existing tags already used in your account. Remove a tag with its ✕, then click Save.
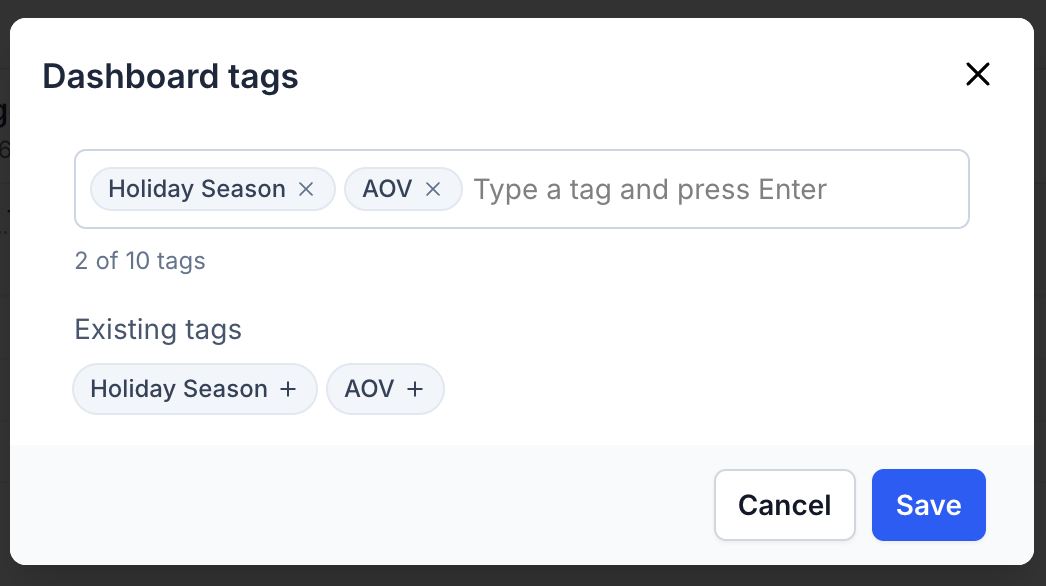 Dashboard Tag Editor
INFO
A dashboard can have up to 10 tags, each up to 40 characters. Tags are not case-sensitive: "marketing" and "Marketing" are treated as the same tag, and the spelling already used in your account is kept.
Filtering by Tag
The dashboard list shows a row of tag chips for every tag used in your account. Click a chip to filter the list to dashboards with that tag, click it again to remove it, or click Clear to remove all tag filters.
When several tags are selected, only dashboards that have all of the selected tags are shown. The selected tags are stored in the page URL, so you can bookmark or share a filtered list.
In the grid view, each dashboard shows a tag icon with the number of tags. In the list view, this appears in the Tags column. Hover over it to see the tag names.
Sharing Dashboards
Dashboards can be shared with other team members or roles. Sharing options include:
Only you – Only you can view and/or edit the dashboard
View only - Anyone on your account can view your dashboard, but only you can edit it
Account - Allows editing capabilities to anyone on your account.
To manage sharing permissions, click the settings icon on the top-right and click "Access".
INFO
Only the user who created the dashboard can modify the access level or archive the dashboard.